Before starting the qualitative research, a Perception Test (Annex 3) was engineered. The goal of the test was to verify the user’s awareness about the calorie content and weight of food items and to find if this has an impact on the lack of progress that users mentioned in the quantitative research.
Three different tests were performed. A food item was placed in front of the participants, and they had to guess its weight and calorie content.
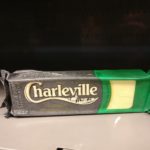
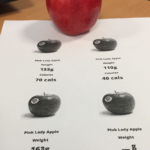
The tests were made with a block of cheese (Fig. 1), a plate of mashed potato (Fig. 1) and an apple (Fig. 1). Before the tests, it was established that any answer between 10% more or 10% less from the actual answer would be accepted as correct. In total, 71 people participated in this exercise.
Figure 1. Items used during the Perception Test.
Results
The results (Fig. 2) showed that 22.53% of the calorie guesses stayed within the established accuracy margin while 15.49% of the weight guesses remained inside that margin.

| Block of Cheese | Mashed Potato | Apple | |
|---|---|---|---|
| Touching Allowed | Yes | No | Yes |
| Multiple Choice | No | No | Yes |
| Number of Participants | 21 | 30 | 20 |
| Weight | 180 grams | 285 grams | 133 grams |
| Calories | 702 kcal | 233 kcal | 70 kcal |
| Weight (± 10%) | 4.75% | 15% | 35% |
| Calories (± 10%) | 9.52% | 23.33% | 35% |
Figure 3. Perception Test data.
In conclusion, participants were not able to have an accurate or an approximate accepted guess when comes to weight and calorie contents of food products, but when having a visual aid together with a multiple choice, their accuracy increases substantially.


